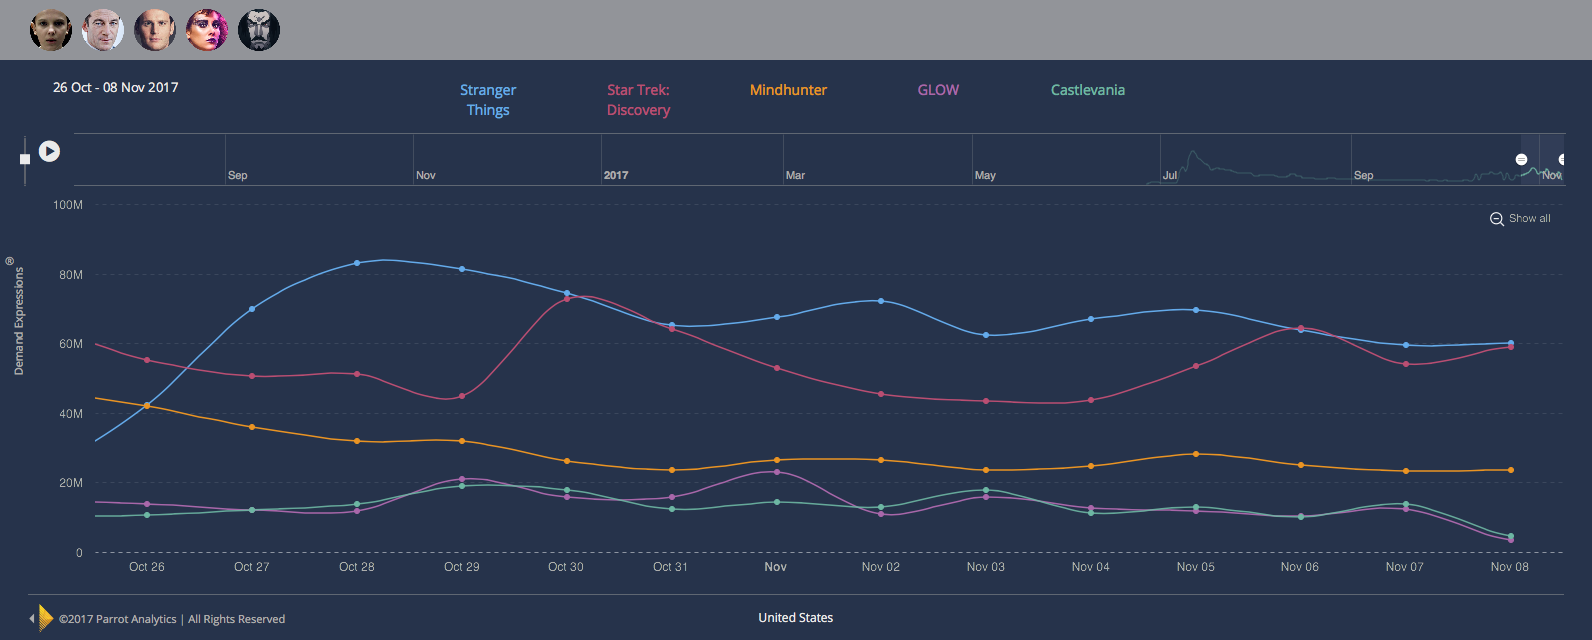
In the United States, the second season of Stranger Things dominated the chart while Star Trek: Discovery is #2 – we are now at the halfway point through the first half of its inaugural season. Here are the full insights from Parrot Analytics.
For 26 October, 2017 – 8 November, 2017 – Top five Digital Original Series in the United States and Average Demand Expressions®:
- Stranger Things, Netflix: 66,963,292
- Star Trek: Discovery, CBS All Access: 53,881,083
- Mindhunter, Netflix: 28,027,058
- GLOW, Netflix: 13,630,520
- Castlevania, Netflix: 13,117,796
Insights from Parrot Analytics:
- The battle for popularity between two hit series is heating up. Stranger Things is building momentum as the #1 digital original series, ranking above CBS All Access’s Star Trek: Discovery (with 24% more demand).
- A new series appeared this week with Netflix’s Mindhunter making its debut on the list at #3. The 10-part thriller series had twice the demand than Castlevania.
- Rounding out the chart, Netflix’s GLOW and Castlevania reappeared in the top ten at position #4 and #5, respectively; therefore, pushing The Handmaid’s Tale off the top five. This is the first time that the sci-fi drama has not appeared since its premiere in April 2017.
Parrot Analytics is a data science company that empowers media companies, brands and agencies to understand global audience demand for television content. Demand Expressions® is the global TV measurement standard developed by Parrot Analytics, which represents the total audience demand being expressed for a title, within a market. Audience demand reflects the desire, engagement and viewership, weighted by importance; so a stream/download is a higher expression of demand than a ‘like’/comment.
Wielding the world’s largest audience behavior data sets, the company has developed the world’s only global cross-platform, country-specific audience demand measurement system. Parrot Analytics captures an unprecedented spectrum of actual audience behavior including video streaming consumption, social media, blogging platforms, file-sharing and peer-to-peer consumption spanning 249 countries. This enables media companies, for the very first time, to understand audience demand for content across all content distribution platforms in all markets around the world.
For more insights visit www.parrotanalytics.com


[…] It’s still in the top five in the U.S. for streamed content in the last fortnight. […]